What is mytop?
Mytop is an open source command line tool used to monitor MySQL/MariaDB queries. It is similar to the Linux system trace tool, top. Mytop connects to the SQL server and periodically executes the show processlist and show global status commands, the output of which is conveniently displayed in a terminal window. Mytop shows in real time all currently running SQL queries, which can be quickly and conveniently KILL’ed or EXPLAIN’ed, for example, if you want to see the efficiency of indexes. In addition, the total load on the MySQL server and the number of queries per second (QPS) can be monitored. If mytop is running on a slave server, you can see if the slave server is synchronising correctly or how many seconds behind the master.
Configuring Mytop
SSH access to the server is required to use Mytop. Establishing an SSH connection
Mytop on Zone server is able to read SQL connection credentials from WordPress, Magento and Laravel configuration files.
All you need to do is log in via SSH, navigate to the application directory: cd domains/www.domeen.ee/htdocs/ and run mytop.
To set a separate username and password for the SQL connection, after logging into SSH, open the ~/.my.cnf file in a text editor of your choice.
The contents of the file are as follows:
[client]
host     = d150.mysql.zonevs.eu
user     = d150_lisa
password = 0J%yFiuP7KW^6O9Y
user should be the SQL username and password should be the SQL password. If necessary, they can be found in the web application settings file.
You can also create a connection by specifying the settings directly as command line parameters.
Example:
:~> mytop -u d150_lisa -p 0J%yFiuP7KW^6O9Y -h d150.mysql.zonevs.eu
Once the connection is established, the following will appear:
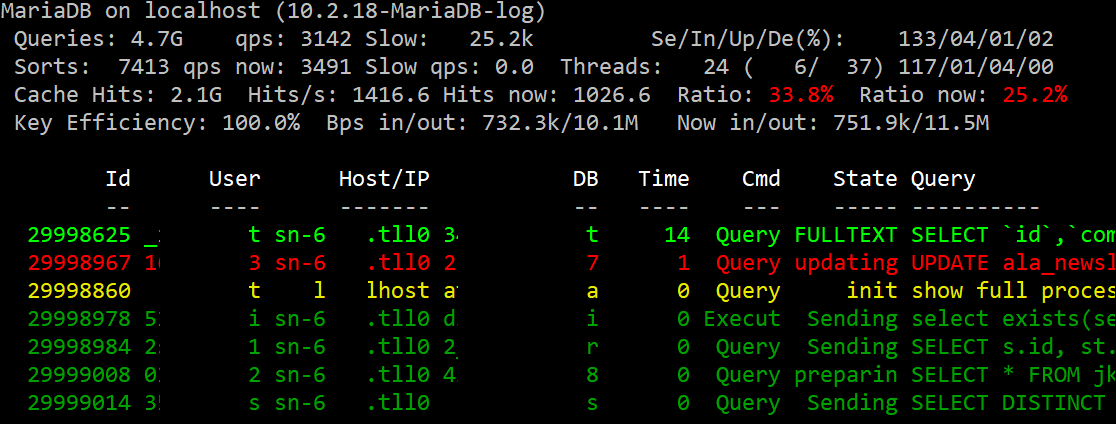
String colours
In order to easily distinguish between read and write requests, all SELECT requests are green and UPDATE/DELETE/ALTER requests are red. All other queries are yellow. If a query has been running for more than 10 seconds, the colour will change to light green or light red respectively. To see the colours, the SSH client must support ANSI colours. To turn colours on or off, press the ‘C’ key.
Columns
- Id – is the identifier of the connection. Each new connection gets a new identifier. This number is used to get additional information about the query.
- User – the name of the user with whom the connection to the SQL server is established.
- Host/IP – the host name or IP of the client from which the connection is being established. This is usually the web server hostname or “localhost”.
- DB – name of the database in which the corresponding query is executed.
- Time – the time during which the query is executed.
- Cmd – type of SQL query.
- State – the state of the SQL query.
- Query – SQL query that is currently being executed.
It is worth noting that the length of some column values has been truncated to save space. For example, the database name may be incomplete. Also, only the beginning of a long query is displayed. To find out the exact database name and query, it is worth using EXPLAIN.
EXPLAIN query
If you see a query in the list that is taking too long to run, you can simply EXPLAIN the query by pressing ‘e’ and entering the Id of the query.
The next output will show the database name and the full length query, followed by the EXPLAIN output. If the number of rows passed in the query exceeds 1000, the corresponding information is displayed in red.
Killing query
To kill a query, press the ‘k’ button and enter the request ID.
Exit Mytop
Press ‘q’ to exit the programme.
Monitoring server queries
Pressing the ‘m’ button puts mytop into “Queries per second” mode and displays the number of SQL queries per second. You can exit this mode by pressing ‘q’.
Inactive queries
Mytop does not display inactive (sleeping) queries by default. To see these queries, you must press the ‘i’ key.
Additional information
Pressing the ‘?’ key will display additional information about mytop options.